M203 20260214 Trigonometric Functions
1. Graphs of Trigonometric Functions
• $y = A \sin(kx + m) + n$
• $y = A \cos(kx + m) + n$
• $y = A \tan(kx + m) + n$
• $y = A \cot(kx + m) + n$
正弦函数的图像特征 | Image Characteristics of $\sin(x)$
正弦函数 $y = \sin(x)$ 的图像被称为正弦曲线 (Sine Wave),其核心特征如下:
1. 周期性与值域 | Periodicity & Range
- 周期 (Period): 图像每隔 $2\pi \approx 6.28$ 重复一次。
- The graph repeats every $2\pi$ units.
- 值域 (Range): 函数值波动在 $[-1, 1]$ 之间。
- The output stays within the interval $[-1, 1]$.
2. 对称性 | Symmetry
- 奇函数 (Odd Function): 图像关于原点 $(0,0)$ 中心对称。
- The graph is symmetric about the origin, meaning $\sin(-x) = -\sin(x)$.
- 轴对称 (Axial Symmetry): 关于过波峰或波谷的垂线(如 $x = \frac{\pi}{2}$)对称。
- It is symmetric about vertical lines passing through peaks and troughs.
3. 五点作图法 | The Five-Point Method
在一个周期 $[0, 2\pi]$ 内,图像由以下关键点确定:
1. 原点 (Start): $(0, 0)$
2. 波峰 (Peak): $(\frac{\pi}{2}, 1)$
3. 中心 (Mid): $(\pi, 0)$
4. 波谷 (Trough): $(\frac{3\pi}{2}, -1)$
5. 终点 (End): $(2\pi, 0)$
4. 变换公式 | General Transformation
对于函数 $y = A \sin(\omega x + \phi) + B$:
- $A$ (Amplitude): 振幅,决定波动的高度。
- $\omega$ (Frequency): 频率,决定周期的快慢 ($T = \frac{2\pi}{\omega}$)。
- $\phi$ (Phase): 相位,决定图像的左右平移。
- $B$ (Offset): 垂直位移,决定图像的上下移动。
1 ) Draw the graph of $y = \sin x$, $y = \cos x$, $y = \tan x$. Find the period.
3 ) What is the symmetry relationship of $\sin x$, $\cos x$, $\tan x$?
What is the asymptote of $\tan x$?
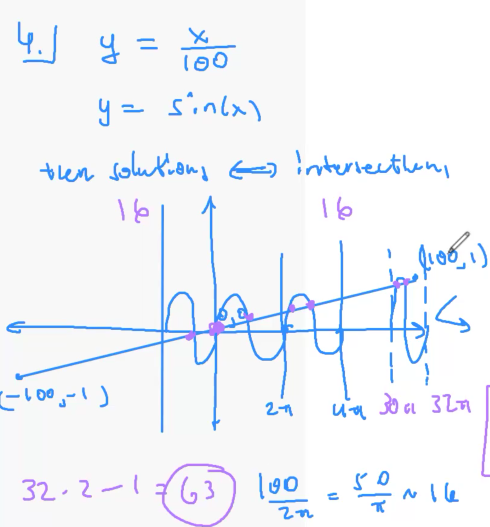
4 )What is the number of solutions of the equation $\dfrac{x}{100} = \sin x$?
5) At how many points with $x$-coordinate between $0$ and $100$ do the graphs of $y = \sin x$ and $y = \cos x$ intersect?
To find the number of intersections for $\sin x = \cos x$ (or $\tan x = 1$) in the interval $(0, 100)$:
1. General Solution
The graphs intersect when:
$$x = \frac{\pi}{4} + k\pi, \quad k \in \mathbb{Z}$$
2. Range Analysis
We need to find the number of integers $k$ such that:
$$0 < \frac{\pi}{4} + k\pi < 100$$
Subtracting $\frac{\pi}{4}$:
$$-\frac{\pi}{4} < k\pi < 100 - \frac{\pi}{4}$$
Dividing by $\pi$ ($\approx 3.14159$):
$$-0.25 < k < \frac{100}{\pi} - 0.25$$
$$-0.25 < k < 31.83 - 0.25$$
$$-0.25 < k < 31.58$$
3. Conclusion
The possible values for $k$ are $\{0, 1, 2, \dots, 31\}$.
The total number of points is 32.
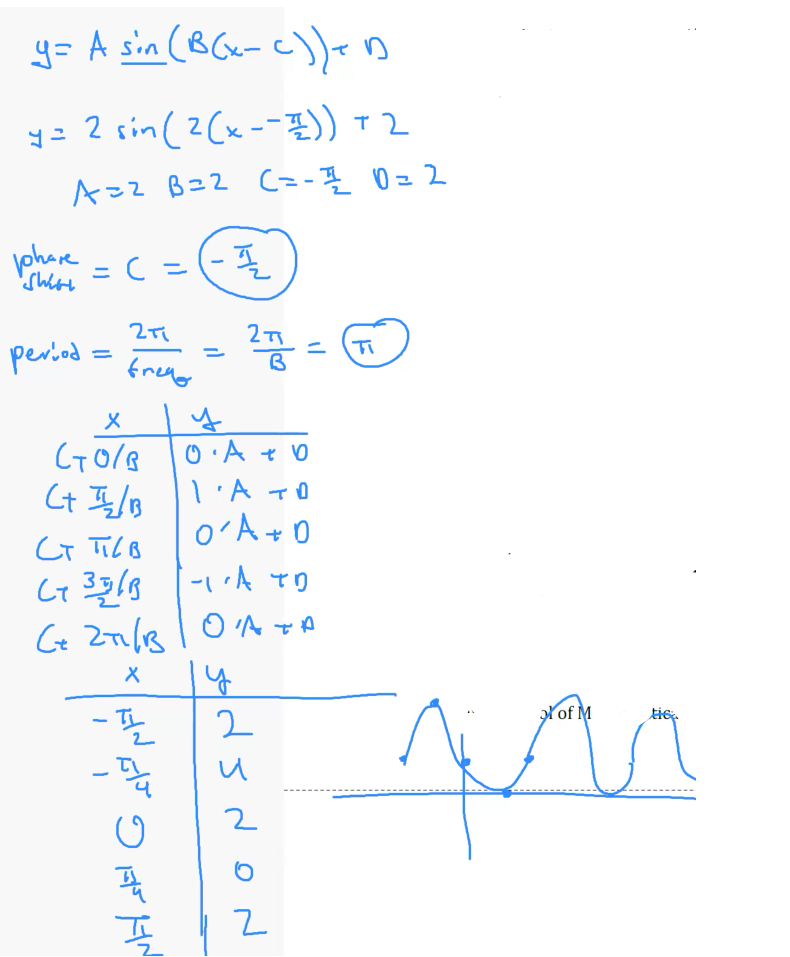
6 ) Draw the graph of $y = 2\sin(2x + 1) + 2$, what is the period and phase shift?
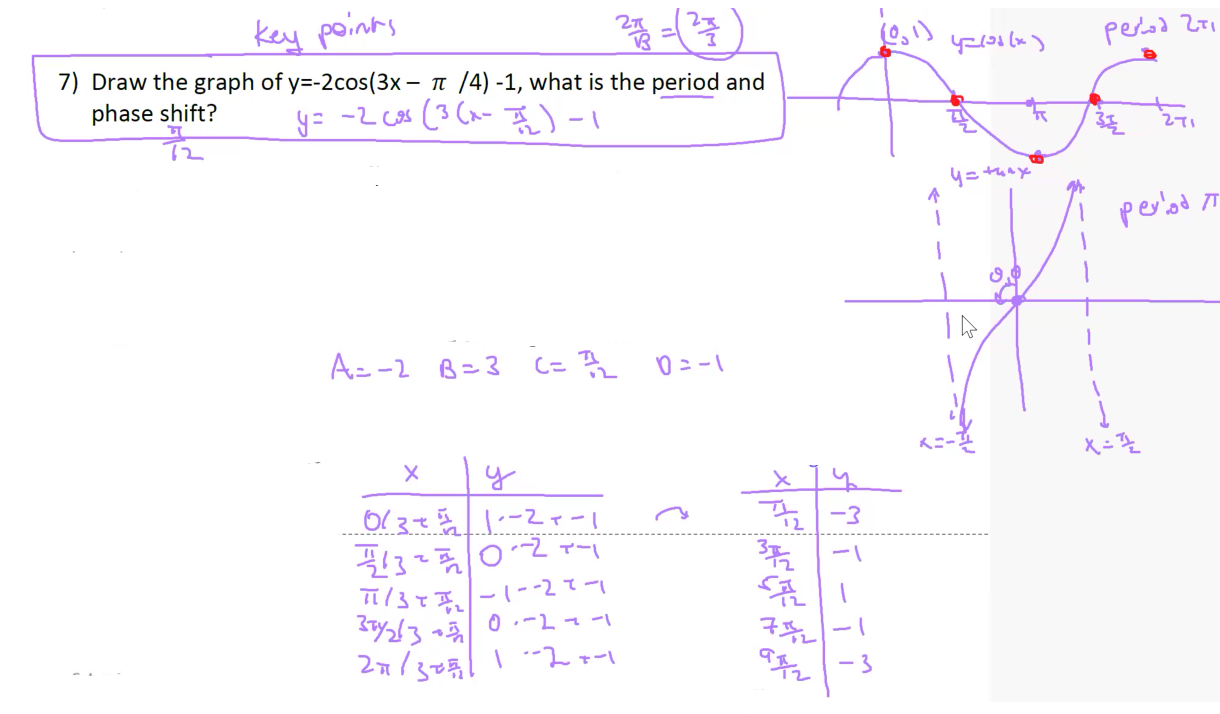
7 ) Draw the graph of $y = -2\cos\left(3x - \dfrac{1}{4}\right) - 1$, what is the period and phase shift?
The Vertical Line Test is a simple, visual method used to determine whether a graph (typically a curve in the Cartesian coordinate system) represents a function.
1. Core Principle
According to the definition of a function, every input ($x$-value) must correspond to exactly one output ($y$-value).
- The Method: Imagine a vertical line moving from left to right across the coordinate plane.
- The Criteria: * If the vertical line intersects the curve at no more than one point (0 or 1 point) everywhere, then the graph is a function.
- If the vertical line intersects the curve at two or more points at any location, then the graph is not a function.
2. Comparison of Common Examples
| Type of Graph | Intersections | Is it a Function? | Example |
|---|---|---|---|
| Non-vertical Line | Always 1 | Yes | $y = 2x + 1$ |
| Upward Parabola | Always 1 | Yes | $y = x^2$ |
| Circle | 2 (in most areas) | No | $x^2 + y^2 = 25$ |
| Sideways Parabola | 2 (in most areas) | No | $x = y^2$ |
3. Summary
The Vertical Line Test is essentially checking for "Single-valuedness."
Note: This is exactly why we restrict the domain and range of inverse trigonometric functions. By limiting the interval, we ensure the curve passes the vertical line test, allowing it to be defined as a function.
2. Inversion Function
The inverse of $y = \sin x$ is $y = \arcsin(x)$ (or $\sin^{-1}x$).
- Definition: It finds the angle $y$ whose sine value is $x$.
- Domain (Input): $[-1, 1]$ (because $\sin x$ outputs between -1 and 1).
- Range (Output): $[-\frac{\pi}{2}, \frac{\pi}{2}]$ (to ensure it is a function, we restrict it to one principal branch).
- Property: $\sin(\arcsin(x)) = x$ and $\arcsin(\sin(y)) = y$ (within the restricted range).
The inverse of $y = \cos x$ is $y = \arccos(x)$ (or $\cos^{-1}x$).
| Feature | y=cosx (Restricted) | y=arccosx |
|---|---|---|
| Input | Angle ($\theta$) | Ratio ($x$) |
| Output | Ratio ($x$) | Angle ($\theta$) |
| Domain | $[0, \pi]$ | $[-1, 1]$ |
| Range | $[-1, 1]$ | $[0, \pi]$ |
| Feature | y=tanx (Restricted) | y=arctanx |
|---|---|---|
| Domain | $(-\dfrac{\pi}{2}, \dfrac{\pi}{2})$ | $(-\infty, \infty)$ |
| Range | $(-\infty, \infty)$ | $(-\dfrac{\pi}{2}, \dfrac{\pi}{2})$ |
| Asymptotes | Vertical ($x = \pm \dfrac{\pi}{2}$) | Horizontal ($y = \pm \dfrac{\pi}{2}$) |
1 ) Evaluate $\arcsin \left( \dfrac{\sqrt{2}}{2} \right)$
2 ) Evaluate $\arcsin\left(\sin\pi\right)$
8 ) What is the value of $\arcsin\left(\sin \dfrac{5\pi}{3}\right)$?
4 ) Evaluate $\sin\left(\arccos \dfrac{4}{5}\right)$
9 ) $\tan\left(\arccos \dfrac{2}{3}\right) =$
3. Parameterization
A parametrization (represented as $x = x(t), y = y(t)$) is a set of functions where each coordinate depends on an independent parameter, typically time $t$.
Is a Parametrization a Function?
- Component-wise: Yes. $x(t)$ and $y(t)$ are individual functions of $t$ because each $t$ yields exactly one $x$ and one $y$.
- The resulting curve: No, the path in the $xy$-plane often fails the Vertical Line Test.
2) Find the graph of the parametric equations
$x = 3 + 2\cos t$, $y = 4 + 2\sin t$.
3 ) Find the graph of the parametric equations $x = \sin t$, $y = 3 - 2 \cos 2t$
1:56:55 A pitfall
6 ) Find parametric equations for $x$ and $y$ such that $x^2 - 3y^2 = 1$
What is the graph of the parametric equations
$x = \dfrac{4}{1 + t^2}$,
$y = \dfrac{4t}{1 + t^2}$
One important detail: As $t \to \infty$ or $t \to -\infty$, both $x$ and $y$ approach $0$. However, looking at the original equation $x = \frac{4}{1+t^2}$, $x$ can never actually be $0$ for any real value of $t$. Therefore, the graph is the entire circle except for the point $(0, 0)$.